Join the Leading Global Eye Health Alliance.
Membership-
Choose an alternate language here
- Membership
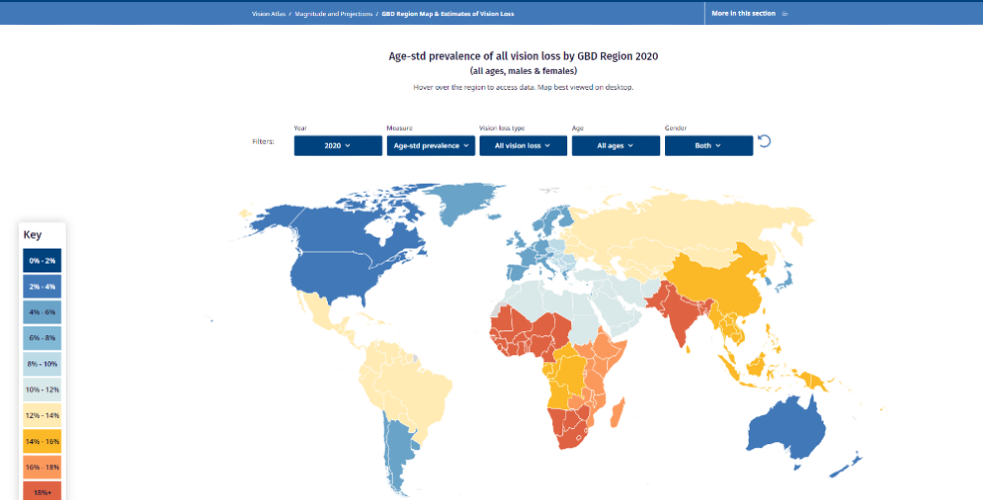
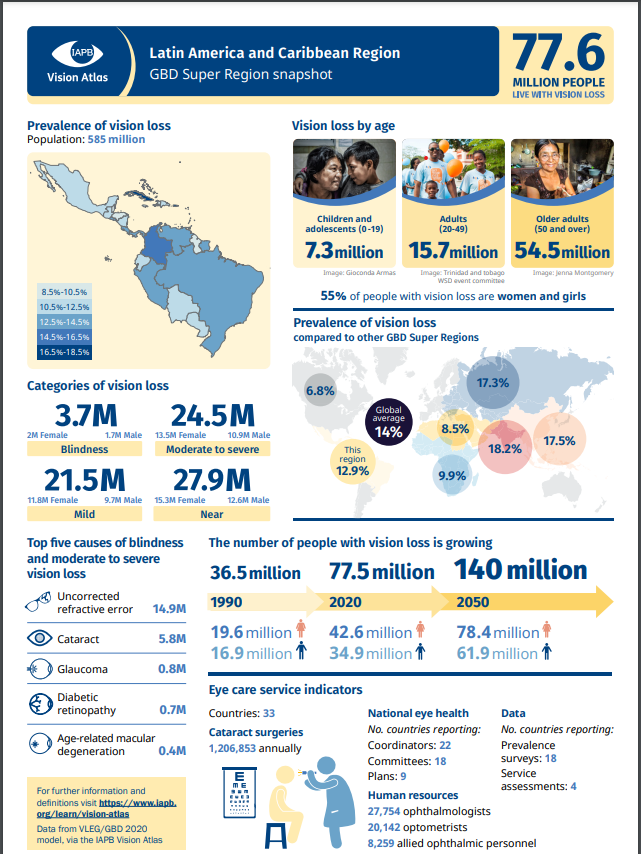
GBD Region Map of Prevalence of Vision Loss
The official launch of the IAPB Vision Atlas at the United Nations Friends of Vision event is today. For some, this may lead to an important question: why do we need the Vision Atlas?
The Vision Atlas gives a panoramic view on all things eye health and is a compilation of the very latest eye health data and evidence. It is a tool for all who believe that in the 21st century, no one should have to live with vision loss from eye conditions that can be easily treated or prevented.
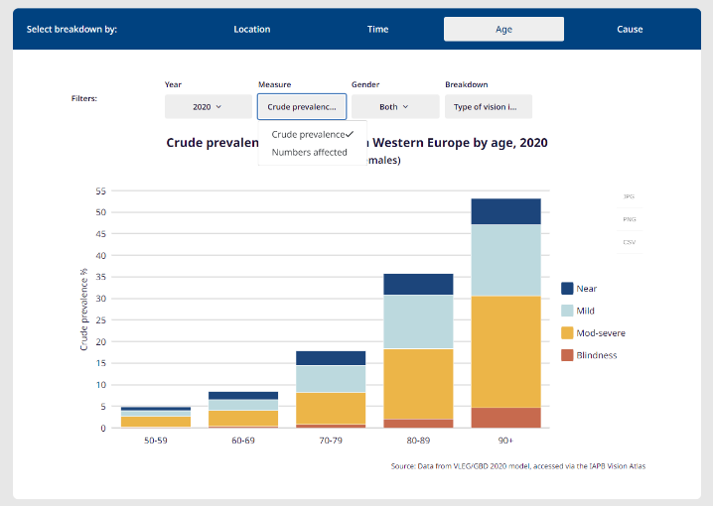
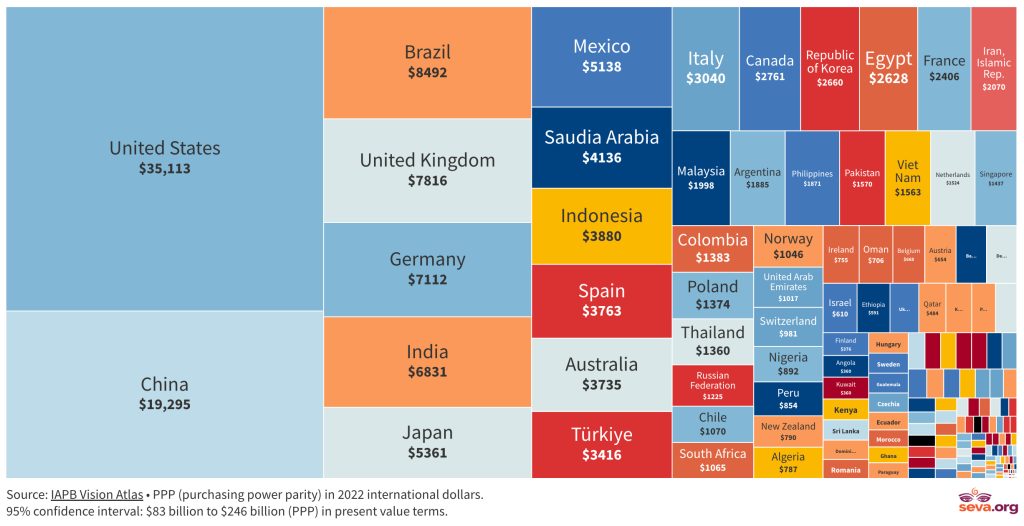
Powered by the data from the Vision Loss Expert Group (VLEG) /Global Burden of Disease (GBD) 2020 model, it transforms data from the realm of academic journals to interactive maps, charts and narratives that can be used for advocacy and planning to make real world impact.
Vision loss is linked to socio-economic disadvantage; 90% of people with vision loss live in low- and middle-income countries. The interactive maps are a powerful tool to highlight the inequalities and draw attention to the regions and countries most in need of eye care services.
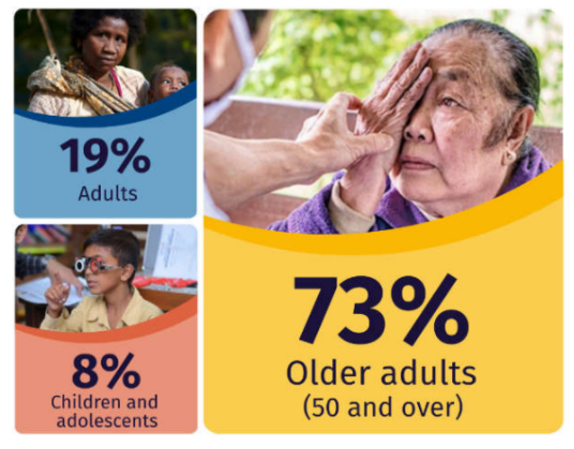
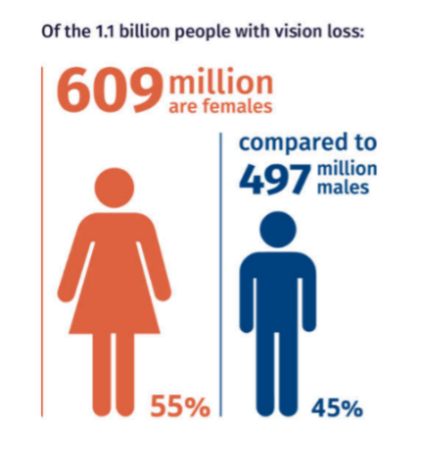
The infographics and images on the Vision Atlas are effective tools to highlight the inequality of the burden of vision loss experienced by women and older adults.
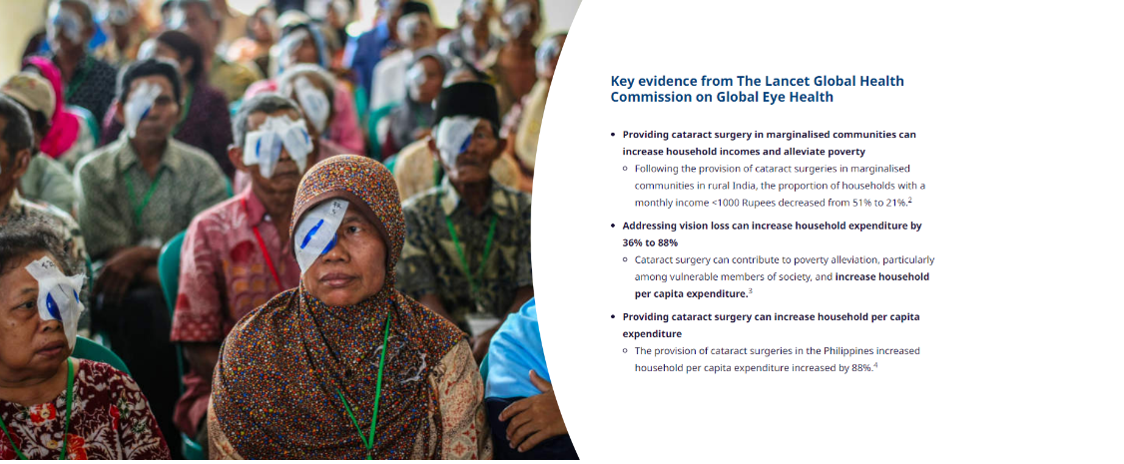
With key contributions from the Lancet Global Commission on Eye Health, and the VLEG, the global and regional narratives are intertwined throughout the Vision Atlas linking the best evidence available to demonstrate the impact vision loss has on individuals, communities and the global economy.
Eye care needs and services vary between regions, countries and populations within countries. The interactive maps and breakdown charts, which are presented at GBD Super region, GBD Region and Country levels enable you to view and present subsets of the VLEG/GBD 2020 data. These subsets are easy to download for your presentations using the buttons on the right of the chart. The global narrative and the most commonly used regional and global data can be downloaded as snapshots in pdf format.
With the recent World Health Assembly resolution on eye health and new targets and indicators being set for the sector, the Vision Atlas is an invaluable place to collate national data to inform and track progress. The country dashboards currently include data on the WHO Global Action Plan and links to IAPB members with offices in that country. We encourage you to connect with members working in the country.

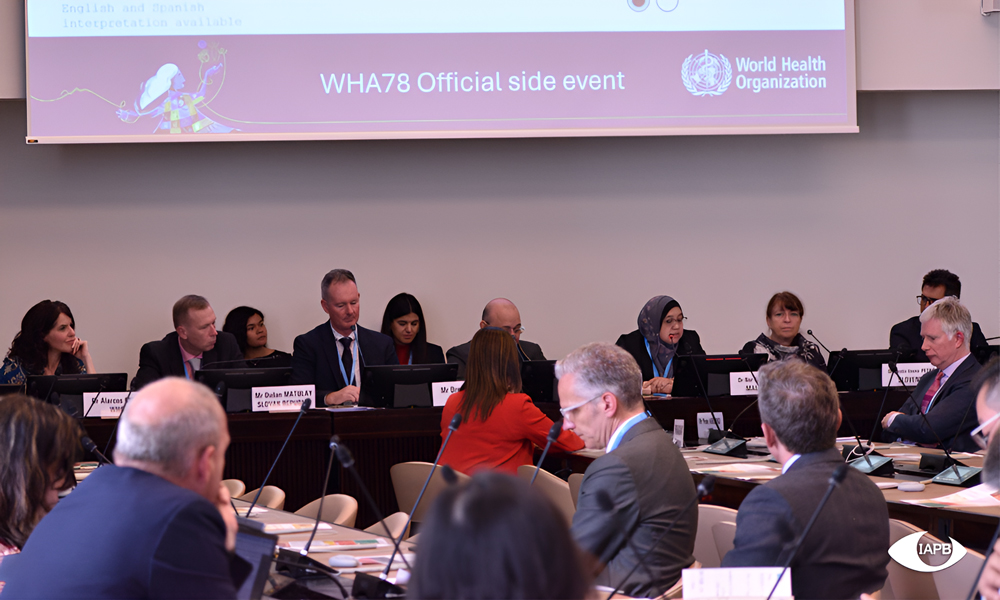
Jessica Crofts-Lawrence and Simon Darvill on last week's UN Friends of Vision Event
Why the intersection of vision health and population aging opens a key opportunity to achieve health goals.


Victoria Sheffield, our Vice-President recaps 2020 at IAPB and dubs it a year of Resilience.