Join the Leading Global Eye Health Alliance.
Membership-
Choose an alternate language here
- Membership

New estimates of vision loss were published today in The Lancet Global Health as part of the updated Vision Loss Expert Group (VLEG)/Global Burden of Disease (GBD) 2020 model. These two papers are a significant update to the global evidence base.
The IAPB has compiled a list of FAQs to assist members in understanding what these new estimates mean for our current understanding of vision loss.
The Vision Loss Expert Group is an international group of ophthalmologists and optometrists with experience in ophthalmic epidemiology. The VLEG works closely with the Global Burden of Disease study, to generate global estimates of vision loss.
The 2020 update incorporates data from 528 studies in 112 countries (from 1980 to 2018). This is a substantial addition of new data sources from the previous estimates and includes regional estimates and forecasts of vision loss to 2050.
While the VLEG/GBD estimates are global estimates of vision loss, they are sometimes reported for specific population groups. Due to the way data is collected, the most reliable evidence is found in adults 50 years and over and for vision loss that is moderate or worse (bold in table 1).
| Reporting category | Subsets* |
|---|---|
| Severity of vision loss | 1) Blind 2) Moderate to severe (MSVI) 3) Mild 4) Near 5) Total distance (1+2+3) |
| Age | 1) All ages 2) Adults 50+ |
| Geography | 1) Global 2) GBD Super Region (7) 3) GBD Region (21) 4) Country |
| Cause of vision loss | Only available for: 1) Vision loss subsets: Blind and moderate to severe (not mild or near) 2) Age subset: Adults 50+ (limited availability for all ages) 3) Geographic subset: Global, GBD Super Region and GBD Region (not countries). |
The IAPB Vision Atlas draws on the VLEG data to present a global narrative of vision loss. This means that there is a focus on all categories of vision loss and across all ages, recognising that the most reliable data are found in adults over 50 years. The Vision Atlas visualisation tools allow users to choose which subsets of data they wish to examine, using the interactive maps and charts.
Visit the IAPB Vision Atlas to see a summary of the key global, regional and country level numbers.
The VLEG press release states: “the leading cause of blindness was cataract, accounting for 15 million people… It also caused severe vision impairment in 78 million people”.
This is a subset of the total burden of cataract. Once moderate to severe vision impairment and other age groups are taken into account, the total number of people living with vision loss due to cataract is 100 million.
| Age (group) | Blindness | Moderate to severe | Total |
|---|---|---|---|
| Children & Adolescents | 0M | 0M | 0M |
| Adults | 2M | 5M | 7M |
| Older adults | 15M | 78M | 94M |
| Total | 17M | 83M | 100M |
The VLEG press release states: “Uncorrected refractive error, a condition easily treated with spectacles, was the biggest contributor to moderate or severely impaired distance vision, estimated to affect 86 million people across the globe.”
This is a subset of the total burden of uncorrected refractive errors. Once blindness and other age groups are taken into account, the total number of people living with vision loss due to uncorrected refractive error is 161 million.
| Age (group) | Blindness | Moderate to severe | Total |
|---|---|---|---|
| Children & Adolescents (0-19) | 0M | 25M | 25M |
| Adults (20 – 49) | 1M | 47M | 48M |
| Older adults (50 plus) | 2M | 86M | 88M |
| Total | 4M | 157M | 161M |
The new VLEG/GBD estimates for 2020 include revised estimates for the 1990-2020 period from a new model based on an expanded data set. This means that the 2020 estimates supersede the 2017 estimates. We strongly recommend everyone use the new data which gives a consistent estimate of the past, present and future numbers.
Visit the IAPB Vision Atlas to see a summary of the key global, regional and country level numbers. The key global messages are in the narrative as you scroll down the homepage.
Serge Resnikoff, Professor at University of New South Wales, and a senior author, said: “By 2050, vision loss is projected to affect 1.7 billion people because of population growth and ageing, especially in low- and middle-income countries. Significant additional investments and concerted actions are urgently needed to reverse this trend and provide quality services to everyone, including to the vulnerable and currently neglected populations.”
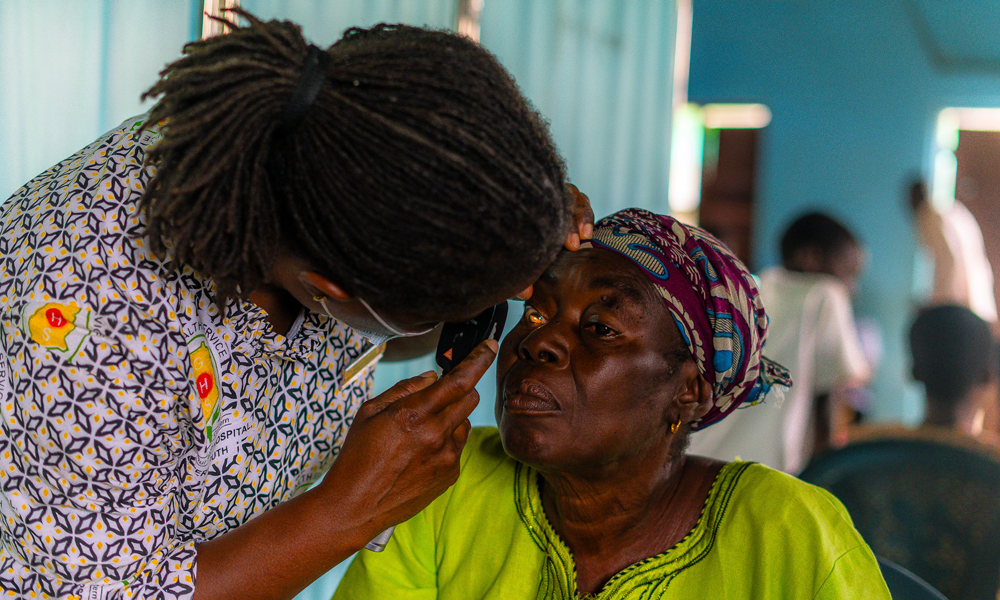
Photo credit: Tumbling E chart for visual Acuity; Erick Mhando, St. Fransis Referral Hospital Eye Department.