


Join a powerful, unprecedented alliance for better eye health for all.
Join IAPBAbout
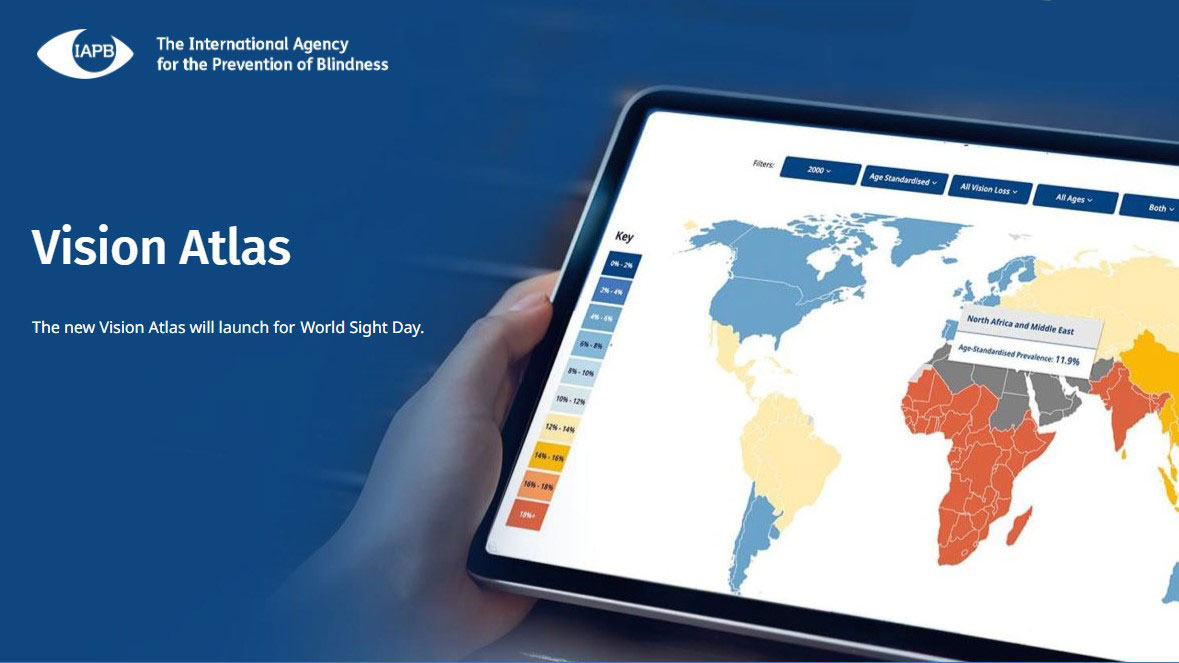
The IAPB Vision Atlas
A compilation of the very latest eye health data and evidence. It is a tool for all who believe that in the 21st century no one should have to live with vision loss from eye conditions that can be easily treated or prevented.
 The IAPB Vision Atlas is a wealth of information relevant to policy makers, health planners, eye health professionals, NGOs, patient groups and advocates. Given that so much of avoidable sight loss is a consequence of inequity and lack of access for the most disadvantaged members of our global community, the IAPB Vision Atlas is an important resource for those responsible for achieving universal health coverage and the implementation of the Sustainable Development Goals. The 2020 update provides a rich mix of data, narrative and interactive presentation tools that make it easy to understand and present complex data sets to a broad audience.
Data
Data for the IAPB Vision Atlas is from two main sources: the estimates of the burden of vision loss by the Vision Loss Expert Group (VLEG) and national performance against the key inidcators laid out in the World Health Assembly resolution 66.4 “Universal Eye Health: a Global Action PLan 2017-2019 (the GAP). VLEG data – a comprehensive database of prevalence eye surveys – provides prevalence of blindness and visual impairment estimates from 1990 to 2020, with projections to 2050. The GAP indicator data, a limited survey of available data, provides cataract surgery, human resources and national planning data.
The new VLEG data features a dramatically enhanced data set to improve the accuracy of the estimates. This update incorporates data from 512 studies in 112 countries to estimate distance vision impairment, an addition of 224 studies (including data from a further 14 countries). Previously, mild vision impairment was modelled by extrapolating from moderate or worse distance vision estimates due to lack of data. However, in this update, data from 59 studies were available to separately estimate mild vision impairment. Finally, 25 studies were used to estimate vision loss from uncorrected presbyopia, compared to 18 last time.
Interactive maps & charts
New in the 2020 update, the maps have a new design and the data can be accessed via several filters. The interactive maps, available for the GBD super regions, regions and country levels, present the data in a form which makes it easy to identify, locate and communicate the disparities in the burden of vision loss across regions and countries. The maps allow you to view large data sets together and compare changes in the burden of vision loss over time, between age groups and genders, making it an ideal tool to be able to communicate to a broad audience. Each map and chart can be downloaded as images making it easy to use in your presentations.
Key narrative and data
In the new 2020 update, we feature a new narrative, telling the key stories behind the Vision Atlas. Drawing on the recommendations from the WHO World Report on Vision, other key data sources and links to the Sustainable Development Goals (SDGs), the data is supplemented with a narrative around key focus areas including : overarching global narrative, the inequality of the burden of vision loss, the impact of vision loss on individuals and communities and the potential solutions to ensure eye care services for all. The key narratives are available as Powerpoint presentation downloads at the end of the homepage and relevant overview pages.
The existence of hundreds of millions of people who are blind or visually impaired from treatable or preventable causes is a shameful social injustice that reflects poorly on the state of the world we live in. It is our hope that the IAPB Vision Atlas will be a powerful tool in the fight to redress the inequities and failings that give rise to this injustice.
Acknowledgements
The production of the IAPB Vision Atlas has been the result of the collective endeavours of many people. IAPB is indebted to the authors of the various sections that make up the IAPB Vision Atlas and thanks them all for their time and their willingness to share their expertise.
Special thanks go to our steering committee for being has been a sounding board for so many aspects of the IAPB Vision Atlas. Our thanks are extended to all members of the steering committee: Serge Resnikoff, Rupert Bourne, Jacqui Ramke, Amanda Davis, Fatima Kyari, Brandon Ah Tong, Sumrana Yasmin and Anthea Burnett for their guidance on the content of the IAPB Vision Atlas.
![]() Our sincere thanks go to all members of the VLEG and particularly Professor Rupert Bourne for his leadership and inspiration to make the VLEG estimates as accessible as possible.
Our sincere thanks go to all members of the VLEG and particularly Professor Rupert Bourne for his leadership and inspiration to make the VLEG estimates as accessible as possible.
Special thanks are due to my IAPB colleagues Simon Day, Drew Keys, Yuddha Dhoj Sapkota and Michael Morton for their diligence in collecting the 2020 GAP data from national co-ordinators and other sources.
The design of the IAPB Vision Atlas is the key to its ultimate success. Special thanks are due to Michael Morton and Anthea Burnett for their oversight, insights and creativity.
Last, but by no means least, our very sincere thanks are afforded to our six sponsors. Without their contribution the Vision Atlas would not have happened.

This website was launched on 8th October 2020 for World Sight Day 2020 – we look forward to continue to update the Vision Atlas with new ways to explore the data and tell the stories it contains over the coming months.
About IAPB
IAPB’s mission is to achieve universal access to eye health. We do this by maximising the impact of the individual and collective work of our network of members and membership bodies.
Our members contribute to and benefit from our collective. Find out the benefits of joining IAPB.