


Join a powerful, unprecedented alliance for better eye health for all.
Join IAPBUnderstanding Data and Evidence
Using data to make comparisons
When comparing the rates of vision loss between countries and regions, it is important to understand what statistic to report.
Understanding prevalence
When reporting the magnitude of vision loss, there are typically three options. This article discusses each of these three options and gives an overview of some of the issues that need to be considered when making reporting prevalence, and particularly when making comparisons.
1) Numbers affected by vision loss
The actual number of people living with vision loss
The ‘numbers affected’ statistic tells you how many people are actually living with vision loss in each country/region. It can be very useful for service planning as it provides the best indicator of how many people are actually living with vision loss.
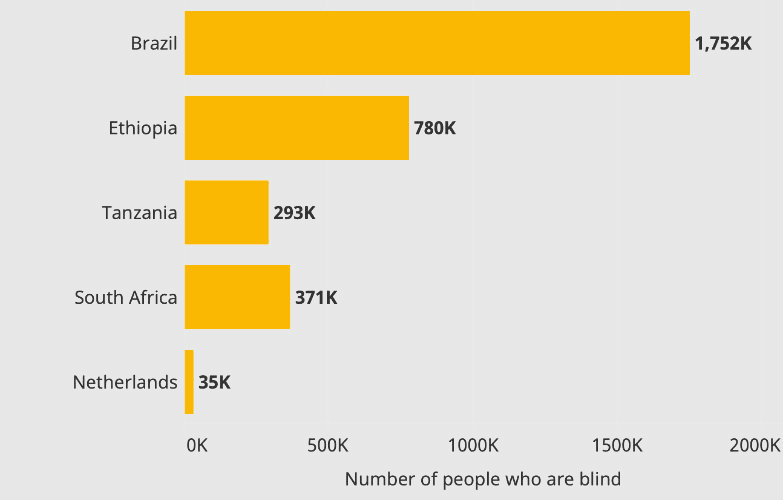
Figure 1: Comparison of the number of people who are living with blindness in different countries
In the example above, Brazil has the highest number of people living with blindness. However, Brazil is also a very large country (213 million people), so it is understandable that it has more people living with blindness than a smaller country like the Netherlands, which has a population 17 million people.
South Africa and Tanzania have very similar populations (both 59 million people), but there are more blind people in South Africa (371 thousand people) than in Tanzania (291 thousand people).
When countries have difference population sizes it is more difficult to compare the ‘burden’ of vision loss with other countries or regions that have vastly different populations. One option, is to consider the proportion of people within each country/region living with vision loss, or the crude prevalence.
2) Crude prevalence (prevalence rate)
The proportion of people living with vision loss. Crude prevalence = numbers affected / total population.
The crude prevalence allows us to understand the proportion of people living with vision loss in each country/region and provides additional context about locations where there are higher or lower proportions of people living with vision loss.
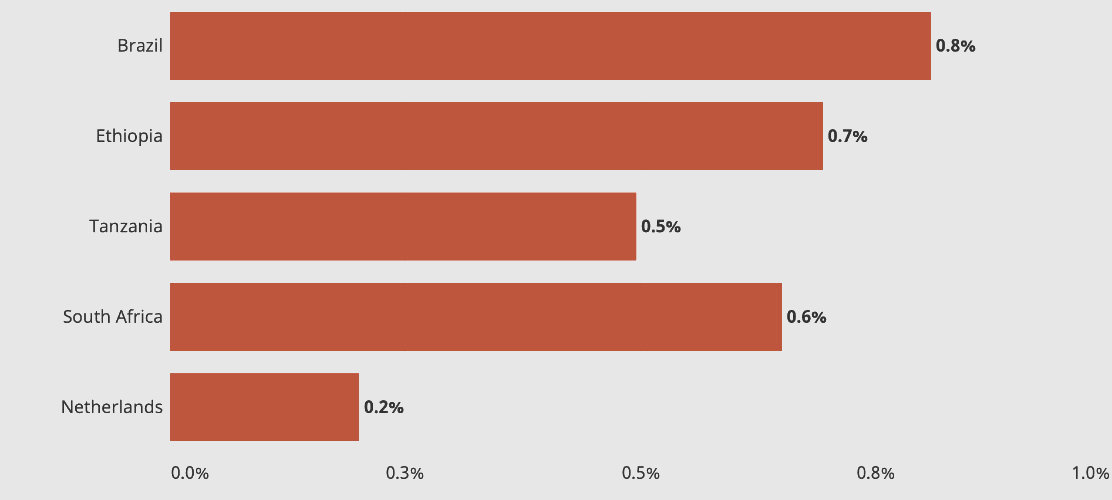
Figure 2: Crude prevalence of blindness
In the examples above, Brazil has the highest crude prevalence of blindness (0.8%). South Africa and Tanzania have similar populations (59 million people) but as South Africa has more people that are living with vision loss (371k versus 293k) the crude prevalence of blindness is higher in South Africa (0.6% versus 0.5%).
However, some countries/regions have very young populations, whereas other countries have many older people. As vision loss is very much associated with ageing (73% of global vision loss is experienced by people over the age of 50), it can sometimes be helpful to consider the age-structure of the population (age-standardised prevalence).
3. Age-standardised prevalence
Prevalence calculated to account for differences in population age structures
Countries can have vastly different population structures — these differences are often depicted in population pyramids or ‘age-gender-pyramids’. Countries that have a high birth rate, and perhaps a relatively low life expectancy have a high proportion of younger people. This is represented by pyramids with a broad base (Figure 3).
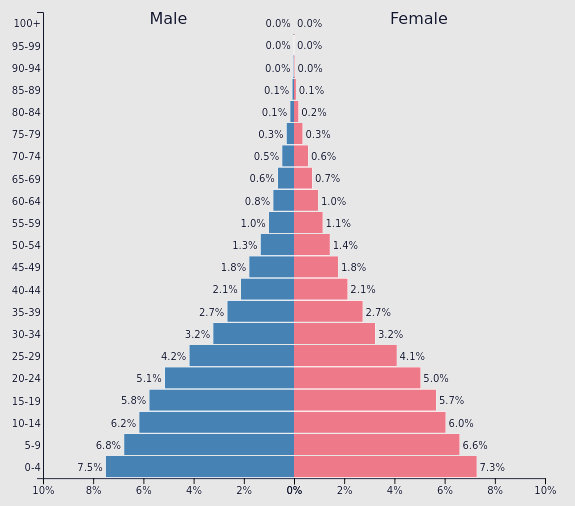
Figure 3: Population age pyramid (Ethiopia). Source: PopulationPyramid
Countries with more older adults are represented with a narrower base (Figure 4).
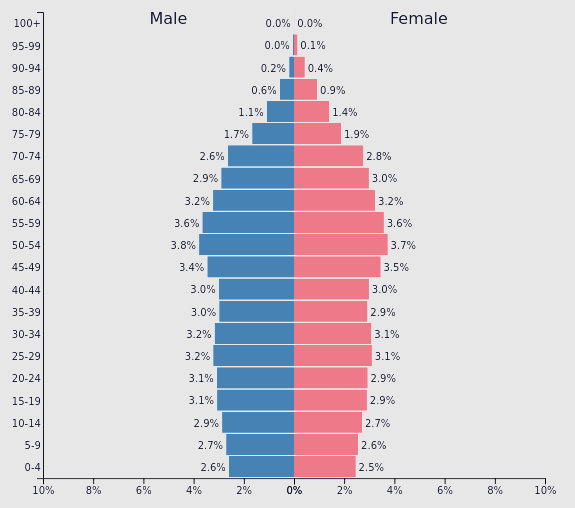
Figure 4: Population age pyramid (The Netherlands). Source: PopulationPyramid
Age-standardisation can tell us ‘what the rates of vision loss would be if each country had identical age structures’. There are various methods for conducting an age-standardisation. The Vision Loss Expert Group (VLEG) used the ‘GBD standard population’ as a reference to calculate the rates of vision loss for each country, if each country/region had the same population as the standard population. The GBD standard population is the average of all country-level age structures.
The age-standardisation example in Figure 5 shows that:
- if Tanzania and South Africa had the same population breakdown as the global average (or the GBD standard population), then 1.1% of the population in Tanzania would be blind, compared to 0.8% in South Africa.
- Although the populations are very similar (59 million people) and there are more people affected by blindness in South Africa than in Tanzania (371 thousand versus 293 thousand) the age-standardised rate of blindness in Tanzania is higher. This is because Tanzania has a much ‘younger’ population, compared to South Africa.
- If there were more older people in Tanzania, as is the case in South Africa, then we could expect the crude prevalence of blindness to be much higher.
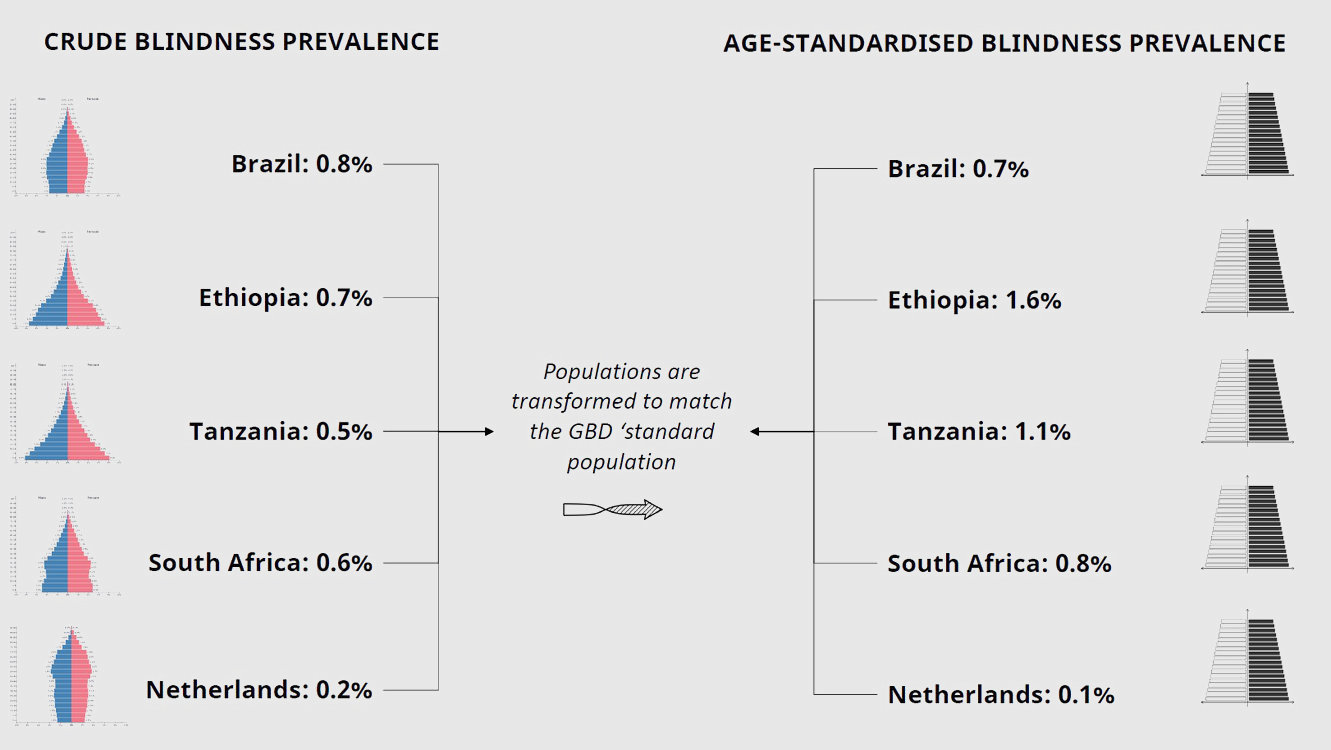
Figure 5: Process of age-standardisation
Ethiopia, which has a very young population compared to the global average, has the highest age-standardised prevalence of blindness out of the examples shown in Figure 5.
Age-standardisation can also be useful for comparing rates of vision loss between females and males, as we can see what the rates would be if there were equal men and women in each country/region. Age-standardisation can also be useful when comparing trends over time, without the confounding effects of population structure changes.