Skip to content

VLEG Data–Frequently Asked Questions

Published: 04.08.2017

[vc_row][vc_column][vc_column_text]Photo by Naegeli Remo; #StrongerTogether Photo competition[/vc_column_text][vc_column_text]Here are some FAQs about the new Vision Loss Expert Group (VLEG) data (our VLEG FAQs!). Do leave your questions below this post as comments (if you have any more) and we will update this post.

  1. Where can I access the new data on blindness and visual impairment prevalence?
    The new data is available for open access at the Lancet global Health site. IAPB has a brief summary available along with an infographic.
  2. Will IAPB be adopting these new numbers immediately?
    An updated version of the IAPB Vision Atlas will be launched on World Sight Day (12 October 2017). It will include an extensive review and analysis of the new VLEG data. From World Sight Day on, IAPB will be using these new numbers to underpin our communications and advocacy work. We strongly encourage IAPB member organisations to do the same.
  3. Will the World Health Organization (WHO) be adopting the VLEG data?
    Well, we can only speak for ourselves. However, it is our understanding that it is the WHO’s intention to use the new VLEG data too in the near future.
  4. How will the new VLEG data impact the planning around the WHO Global Action Plan (GAP)?
    While the GAP was formulated in 2013, and it had used the older WHO figures to do so, the key focus for IAPB is the 25% reduction it urges WHO member states to achieve. The VLEG data goes all the way back to 1990, and it allows us to measure progress from then on. So, we are in an even better position to see how close we are to achieving that 25% target.
  5. Can we compare WHO data from 2010 with the VLEG 2010/2015 data?
    No. That would be like comparing apples and oranges.The new VLEG estimates for 2015 (published in 2017) have also amended their estimates for the 1990-2010 period which they published in 2012-3. So we strongly recommend everyone to just use the new data which gives a consistent estimate of the past, present and future numbers.
  6. What can we expect to see on the IAPB Vision Atlas this World Sight Day?
  • Visualisations. We will have maps and other infographics to make this data accessible and useful for advocacy purposes.
  • The IAPB Vision Atlas will host the currently released prevalence data. It will also host prevalence data all the way back to 1990 (the Lancet paper only gives access to 2015 data at the country level—see appendices).
  • The present VLEG paper only has prevalence percentages. The IAPB Vision Atlas will also include numbers (the number of people who are blind in a country, for example).
  • The Atlas will host new maps with Causes data, showing powerful pie-charts along with the maps in an accessible format.
  • It will also include Global Action Plan indicator data, which shows where a country stands in its ability to meet GAP targets.
  • The Atlas will also include commentary from global experts on the numbers and challenges for the future.

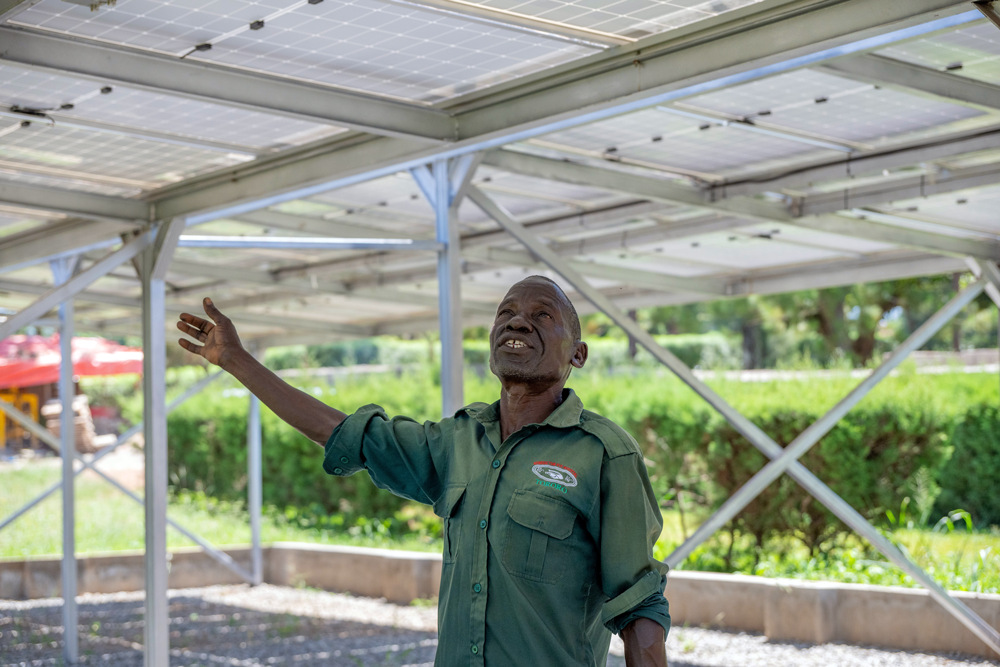
Photo by Naegeli Remo; #StrongerTogether Photo competition.[/vc_column_text][/vc_column][/vc_row]