Join the Leading Global Eye Health Alliance.
MembershipSystems mapping is a collaborative learning process that aims to create a shared understanding of a system. It involves building a conceptual model of the system, focusing on our desired transformation and gaining support from key stakeholders involved in the system.
There are many types of charts, diagrams, and other infographics that collectively make up the toolkit of systems mapping. Here are some of the most common:
Our map is causal, depicting one view of the structure of the system. It translates the broad consensus contained in the “World Report on Vision,” “Lancet Global Commission on Global Eye Health,” and the “2030 In Sight Strategy,” illustrating our understanding of how the eye health system works and some of the critical interventions that can accelerate the realisation of our goal.
The mapping process outlined below has been supported by SIMFO, a Systems Change company who partners with business, finance, civil society, and government to catalyse systems change towards a regenerative and inclusive economy. You can read more about SIMFO in section 6.
So why draw a systems map? Consider the following:
SIMFO’s systems mapping practice is intentionally inclusive, meaning that maps are expansive, allowing all parties to see their perspectives on the system, as well as their work, in a single diagram. This is an important first step. This diagram centres around a shared vision — typically a societal outcome — that no one actor can guarantee independently.
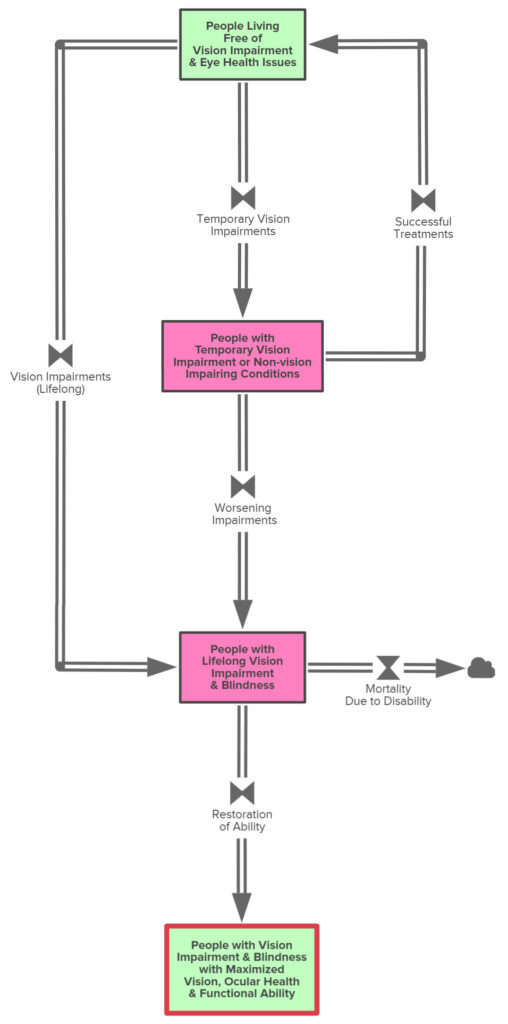
The first step in systems mapping is to identify the collective vision for the initiative and depict the shift that is required to achieve it.
In our case, the map centres on individuals (all of us!) who will most likely experience an eye health challenge within our lifetimes, focusing on how to ensure we can all remain, or quickly return, to a state where we are living with maximised vision, ocular health, and functional ability.
As individuals and organisations, we are used to measuring ourselves by “local” objectives: a device manufacturer seeks to provide more value to clinics and hospitals by designing waste out of their supply chain; a government researcher aims to provide complete and verifiable datasets; an advocate works to ensure that education is provided equitably throughout the country’s rural districts.
Having a systems change goal does not eliminate the importance of these organisation-specific objectives. What it does do is turn a collective’s high-level statement of purpose into an actionable mission, one that, together with other system stakeholders and over a long-enough time horizon, is actually achievable.
For many, this is a highly motivating aspect of participating in systems change!
People will support what they had a hand in creating, so all stakeholders need to be able to see themselves in the work. This map is flexible enough to incorporate all perspectives, including those of stakeholders not “at the table” during the initial stages of the map’s development.
No matter how many people we involve in creating our map, the system and our understanding of it will keep evolving over time. A flexible tool can be updated and stay relevant throughout the entire change initiative.
The map’s architecture is flexible because it is modular. It is made up of two core elements:
Due to the number of stakeholders and relationships represented in the map, some may find it very complicated. However, we often hear from practitioners that their mental model of the system is just as complicated! The map helps them to communicate their view of the system without resorting to over-simplification.
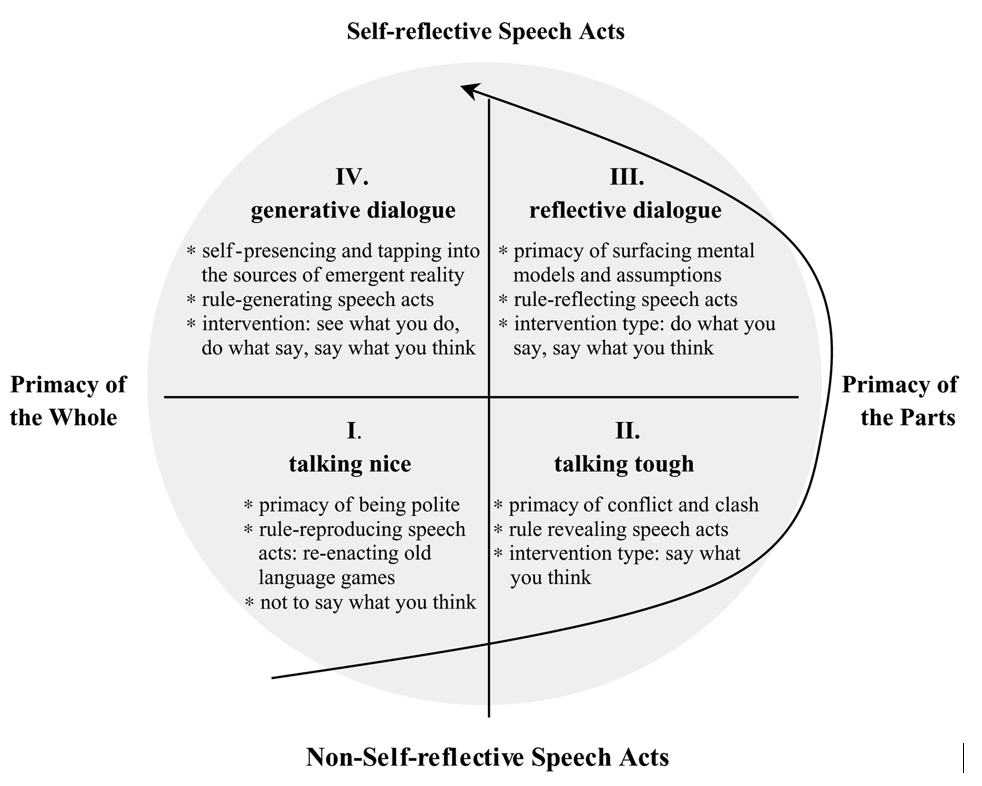
With everyone centred on a shared vision, we shift our participants into the mode of reflecting on their current system. Here we focus participants’ attention on the dual practices of inquiry and advocacy – whereby participants are making explicit their own mental models and supporting one another to do the same. There is no one ‘correct’ perspective, and the purpose of this exercise is to enable participants to see the system through the eyes of others.
When brought into a systems mapping workshop, participants are invited to adopt a learner’s mindset; to get curious about the system and its structure. The goal is not to identify the theoretically correct model of the system, which would require debate and judgement, but instead to engender a sense of appreciation for the many mental models that drive how people in the system act in-practice.
Besides the variables and causal relationships discussed above, there is one other standard systems mapping element we should point out: the feedback loop. There are two types:
These two types of loops are the source of our deepest frustrations and our brightest hopes when working to change a system.
Balancing loops stabilise a system and keep it operating smoothly. These are sometimes called “control loops” or informational feedback loops because they respond to a target we set for the system and work to keep things operating on an even keel. Balancing loops can also be why the system feels so stubborn when we try to intervene to change it, because they are also the structure responsible for the oft-observed “limits to growth” archetype.
Reinforcing loops do the opposite: they are the source of state change in a system. You might be familiar with the term “vicious cycle,” used to describe arms races and bidding wars, where a small disagreement grows out of control and threatens the stability of the system as we know it. But spin things in the opposite direction and you get the “virtuous cycle,” the structure that leads to internet fame and “unicorn” startup valuations.
When looking for leverage points to change a system, feedback loops are a great place to start.
What do feedback loops have to do with interdependence?
Often, we focus on our own actions and goals without considering the feedback loop. We see our interventions as a direct connection between what we do and what we want. However, when we map the system together with other stakeholders, we realise it’s not that straightforward. On the other side of the loop, others are reacting to our actions and altering the environment in which we operate. This collective response can lead to our actions cancelling each other out or pushing us into a situation of unpredictable change.
This is what we mean by interdependence. Because we are connected within the system, my success relies upon your success, and vice versa. Coming to a common understanding of that interdependence reshapes the way we think about taking action, namely that we must do so in coordination with one another. The map is a tool for helping to capture these interconnections in the system, but they do not appear on the page automatically – rather through reflection and discussion.
Holding creative tension is difficult, but doing it together, with a group of people who share the same vision, can be a powerful and transformative experience for the individuals in the room.
Understanding the system as a group is partially an intellectual exercise intended to upgrade our mental models so that we can operate more intelligently as we work day-in and day-out to change the system.
It is also an exercise that engages us at a deeply personal level.
When we are together with the whole system in the room, supported by tools like systems maps and skilled facilitators who can help us hold space for reflective and creative dialogue, our sense of possibility starts to change. Through shared commitment and reciprocity, we cultivate the fertile soil in which ongoing collaboration can flourish.
A generative dialogue is one where participants are focused on envisioning a future for the whole.
Reflective dialogue is a strong start, and, if done well, the participants now share a common understanding of their system, made explicit and visible in the systems map in front of them. But to move into collective action, we must move beyond reflection on the past.
This is typically the follow up or second day of a systems mapping workshop, and while this guide does not go into detail on this part, it is a rich and important part of moving from understanding to action.