

Join the Leading Global Eye Health Alliance.
Membership-
Choose an alternate language here
- Membership
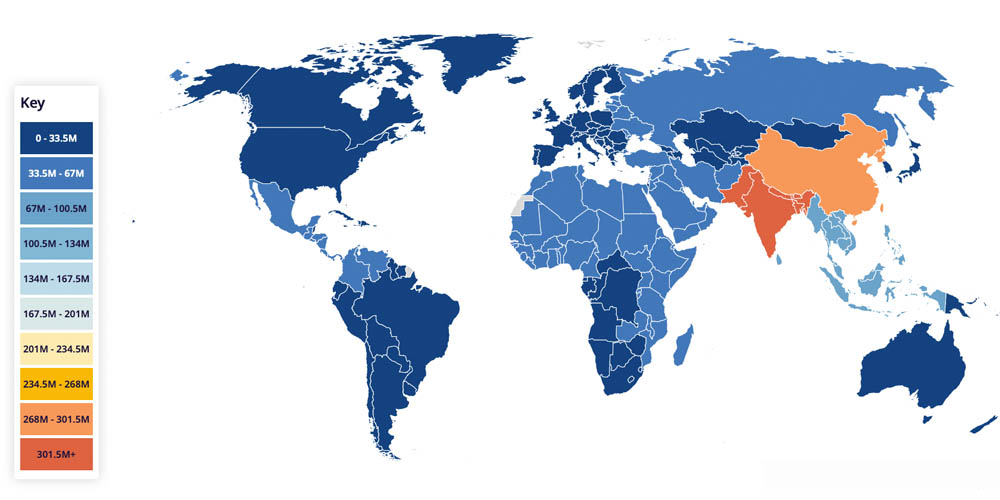
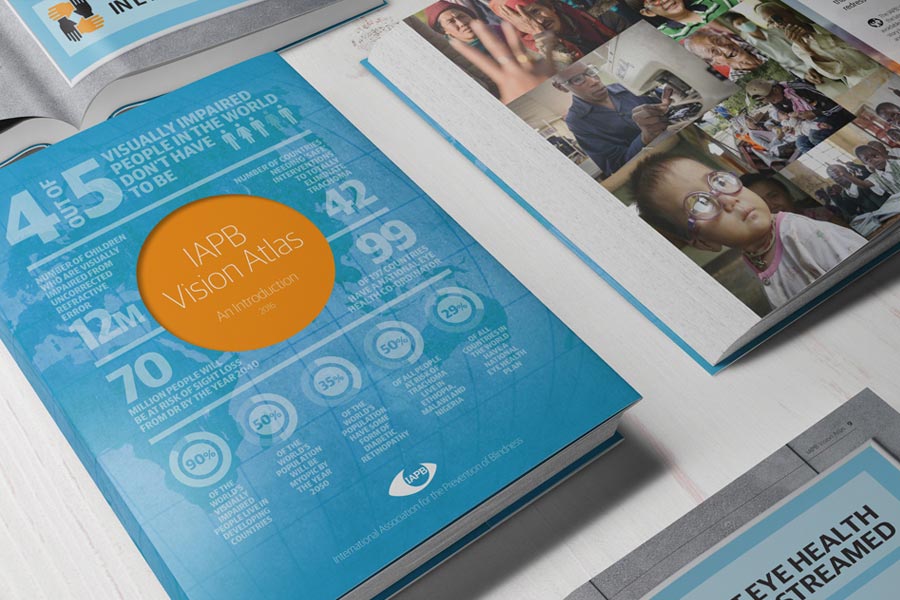
 The IAPB Vision Atlas will be revised with the latest data and projections on World Sight Day this year (12 October 2017). The updated Atlas will include the latest blindness and visual impairment prevalence data (2015) along with the main causes. The prevalence data will go back to 1990 and will also include projections to 2020. These numbers will be by country and can be accessed through a couple of web-based interactive maps.
This World Sight Day, the Atlas will include two new maps—the main causes of blindness and visual impairment (by region) and the main causes of near-vision loss (by region, and only for 2015 with projections for 2020).
The Atlas will also include updated data on the progress towards the Global Action Plan, by presenting updates to the GAP indicator data (CSR, CSC, number of trained personnel etc.). Apart from this, the Atlas will also include commentary on these numbers along with explanations and easy-to-use tools for various eye conditions.
IAPB encourages IAPB member organisations around the world to organize World Sight Day “launch” events to mark the updated IAPB Vision Atlas. You are encouraged to use the data presented for engaging in advocacy and outreach.
A set of key messages for advocacy and for media outreach are available from this page. DO note: we will be sharing a supplement shortly, which will include key messages on the Causes data.
Please download them and write to us at communications@iapb.org if you are planning to organize a World Sight Day event around the IAPB Vision Atlas. Or if you have any questions.
Photo: Boys with balloons at the World Sight Day 2013 event in Trinidad and Tobago. Photo courtesy: Desiree Murray, Volunteers for World Sight Day, Trinidad & Tobago.